
Administrative Tools
More articles in this series
- Part 2: Event Viewer
- Part 3: Windows Firewall With Advanced Security
The Administrative Tools suite within Windows has continued to improve since XP on a slow but steady pace. I wonder though how many average users are aware of the tools and their capabilities. This series of posts will highlight several of those tools and how you may use them to enhance you Windows experience.
First of all, you might ask, what are Administrative Tools and where are they located.

Administrative Tools is one of the folders in Control Panel. It contains customizable tools for administrators and advanced user but I believe the average user can benefit from its use and gain insight into the workings of the computer. The tools themselves are slightly different depending on the version of Windows you are using, I will be discussing the tools in Windows 10 because it is the newest release and therefore contains all of the previous versions. In the description below, their operation will be very similar to previous versions.
Some of the tools are pretty easy to understand by name alone. Others like iSCSI initiator, might take a little more time to master but all of these tools have the capability to transform the average user to a power user. I will be addressing Resource Monitor first because it is easy to view and the basic functions easy to use. This tool can help you understand which applications are using files and analyze unresponsive processes. You may also control certain services and processes (see caution note below). It can be a very powerful tool in helping you understand the working of your computer and how to stop frozen process or learn which programs are consuming too many of your resources. Hopefully, some guidance with using Resource Monitor will allow you to get your feet wet and if you are comfortable you may proceed to some of the more complex aspects of this tool and other tools.
Note: all the screen shots are from Windows 10, including how to access the program. You will find that your version of Windows will work in a very similar manner.
 Resource Monitor
The Resource Monitor can be accessed several different ways within windows. You may use the Ctrl+R buttons to open the run command and type “resmon.exe”, through the Task Manager (ctrl+alt+del), as well as through Administrative Tools tab in the start menu in Windows 7 and in the Control Panel in Windows 7 through 10.
The views displayed below might differ slightly depending on the devices you have on your computer but the basic view will be very similar.
Caution: While this tool is easy to use and view, it is a very powerful tool. I highly recommend that you have a full understanding before making any changes. Experimenting by just clicking to see what will happen may result in very undesirable results. This post is written with the beginner in mind and may contain some tasks you have not encountered.
After clicking on this tool, a window will open displaying the Default Overview window.
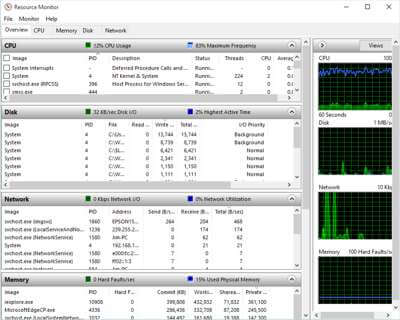
In the Overview tab, each of the Headers may be collapsed or expanded to view different resources simultaneously, and the graphs may be displayed as small, medium or large. You may click on one of the tabs to isolate a particular resource for deeper investigation.
First we will cover the toolbar at the top of the Overview screen. It contains three commands. File-Monitor-Help

File: From the File dropdown menu you may choose to save, load or reset the settings. Resource Monitor opens to the overview screen (shown above) by default. If you make changes to the way RM looks and want to save that setting you would do it here. The next time you open RM you may load those settings again. This can be very useful if you use RM for different things, if you use it to check on your network regularly, you might want to save that setting for future use and access it again by loading that setting.
Monitor: You may stop monitoring the computer if you wish to study a certain time in the process. Starting the monitor will give you a clean set of graphs to view.
During trouble shooting you may wish to increase the width of a column to view all the information. This will of course cause others to scroll off the right edge of the view. Clicking on the “Auto-Fit columns in Window will display each of the columns available in your view.
Help: Unfortunately, the help menu only allows you to view the version number of the program. There is no help content.
Moving down in the overview view you can see that there are four additional tabs you may choose. Clicking on each will allow you isolate that resource and study it in greater detail. Right now we will discuss the Overview tab.
Overview Tab
The benefit of the overview tab is the ability to view all processes simultaneously and see what effect a process might be having on each of the resources.
CPU
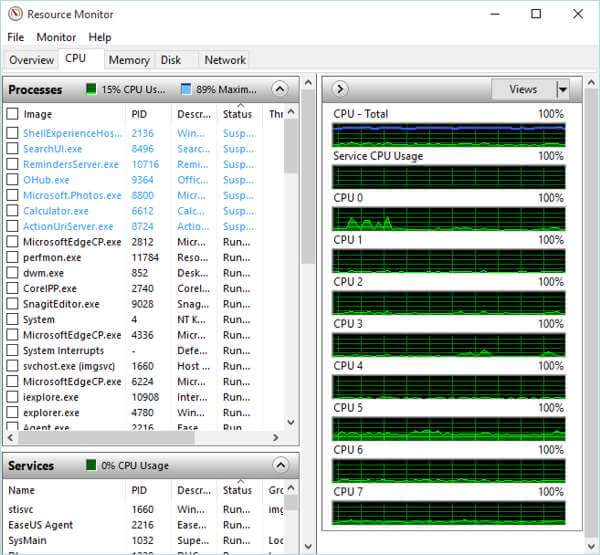
Clicking on the CPU tab will isolate that resource and display each of the processors running. In the image below you will see the graphs section is displaying the Dual Quad Processers on my computer as 8 processors 0-7 as well as the first view of the overall usage in the first graph. The toolbar item “Monitor” now has a new section (Select Processors) to allow you to isolate a single or group of CPUs. Note: in the first graph you are looking at the combined CPU usage, the blue line at the top of this graph indicates the processor frequency. Some processors have the ability to reduce the frequency during low use
Processes
In the Process headers there are seven columns.
- Image or Name: The executable file name. This is the name of the process that is using the CPU’s resources. In many cases it is easy to determine the program if you are familiar with the program. For example, firefox.exe is easy to understand, however, system processes like svchost.exe are harder, the name in parenthesis after the .exe is the process. The PID explained below is much more dependable in troubleshooting your processes.
- PID: The Process ID. After a while you will find the PID to be indispensable in troubleshooting your computer or understanding the effect a process has on your system. The PID is unique to the process not the program, so a program like Avast might have several processes running at the same time and each will have its own PID.
- Description: A very short description of the purpose of the process
- Status: The Process execution status. A process might be displayed as running, suspended or stopped.
- Threads: listed as the number of active threads, a thread is a single processing instance. For example, just as a program may have multiple processes, a process may have multiple threads.
- CPU: Shows the percentage of CPU consumption used by a process. Indicates just how much of the CPU is dedicated to that process.
- Average CPU: This shows the average usage during a 60 second time frame and gives the user a clear picture of the overall effects a process might have on the resource.
In addition, there are now three new headers in the CPU view.
Services
The services section is a list of every service that is currently running, suspended or stopped. Clicking on the check box next to a process in the panel above will filter services, clicking on the image checkbox will select or deselect them all. In the image below, the left view is with no process selected, the right is with svchost.exe selected in the top section, you can see the effects it has on the Services, Associated Handles and the Associated Modules, each section shows that the results are filtered by the selected process. Note: the services section does not have the Threads column but does have a Group column. This column shows services that run together as a group.

Associated Handles and Associated Modules
Handles are pointers that refer to system elements including files, registry keys, events and directories.
Modules are usually the associated dynamic link library (DLL) files but also include other assistance files.
Using the CPU Section
OK, now that you have all this information, what can you do? Using the CPU section of the RM can provide you with valuable information on all of the process in your system.
For example, let’s assume you have a program that hangs from time to time, right clicking on a process of that program will bring up a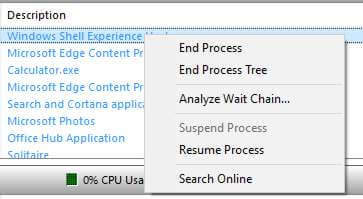 menu giving you the option to select “Analyze Wait Chain” and view the wait chain of that process.
A wait chain shows the sequence of threads and objects that each process has. This tool will help you deal with hung or frozen programs by showing you the threads that have not yet executed. It will identify the actual process that caused the program to freeze by using identifications numbers.
In the image below, I have right clicked on the process Agent.exe. This is a process of the EaseUS Todo Backup Program. I can tell this because of the PID. 2216 is assigned to that process. You can see that the process is waiting on two threads before it will be able to proceed. At this point, I may choose to select them and kill the threads so the process may stop or resume.

Besides the “Analyzing Wait Chain” function, when you right click the drop down menu it will allow you to suspend, kill a process or kill the process tree. You may even check that process online by clicking on “Search Online” button. In addition you may also right click on any of the services and start or stop them.
Now is a good time to issue a another caution. Killing processes during the operation of the system may cause it to hang until a reboot. Therefore, I only recommend you do this when you have saved all your files and are actually working on a frozen process.
Memory
Before we discuss memory I think it will be helpful to understand how Window manages it. Windows creates a virtual memory system made from the available physical memory, combines it with the page file system on the hard disk. By using virtual memory the OS may allocate fixed-length blocks of memory called pages.
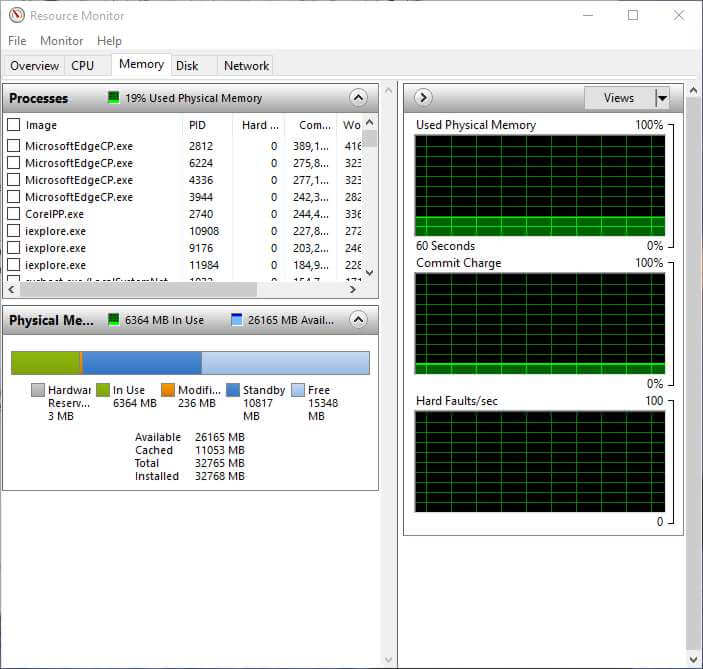
Clicking the Memory tab will bring up a new set of graphs and one new header. This tab displays the effect your process is having on your computer’s memory. You may use this section in much the same way as you did in the CPU sections. Right clicking on the process on the left side of the screen will bring up the same dropdown menu.
The Memory consumption for the process are displayed in several different ways, each column in the memory tab is explained below.
- PID: Use the definition shown for the CPU section mentioned earlier.
- Hard Faults/sec: The number of Hard Faults per second (hard faults {previously called page faults} are not errors but a normal part of memory processing. It just means that a block of memory had to be retrieved from the Page File (Virtual Memory) instead of RAM. However, if this occurs a lot then it is a problem and your computer will appear very slow.
- Commit (KB): This is the amount of virtual memory that is reserved for use by a process. The number displayed is both physical memory and pages that have been reserved for this process.
- Working Set (KB) The working set may be confusing because the amount listed in KB may seem like the process is hogging a lot of resources. It actually consists of two types. Private and Shareable. Adding the total of the private and shareable sets should always equal the Working Set number.
- Shareable (KB) The shareable set is often the largest part of the working set, this memory may be used by any other application. Sharing memory saves memory space.
- Private (KB) The private set is reserved for the actual needs of the process. The private set may not be used by any other program as it is reserved for the associated process. This number is the best indicator to determine the amount of memory that process needs.
Using the Memory Section of Resource Monitor
Hopefully the information above will give you a basic understanding how Windows allocates (manages) memory and the amount of memory a process uses.
Monitoring the number of Hard Faults can give you insight on the number of times a page is read back from the disk. This is a normal operation of your computer but as mentioned earlier when they occur too frequently, it will decrease your system’s responsiveness. If you do see that you computer is swapping memory from disk to physical memory, it might be a good indication that you do not have enough physical memory.
To see which process is the culprit, you may click on a single process in the process panel or by clicking on Image in the process panel, you will select all of them. When you click on one it will display an orange line highlighting that process in the graph.
In the graphic below, you will see the first graph view indicating the number of hard faults per second. In the second graph you will see the effect on the number of faults booting CorelDraw has. I clicked on the CorelDraw process during the programs boot up. You can clearly see that as soon as the boot up is finished it has no additional faults. Finally in the third graph I have all processes selected except CorelDraw.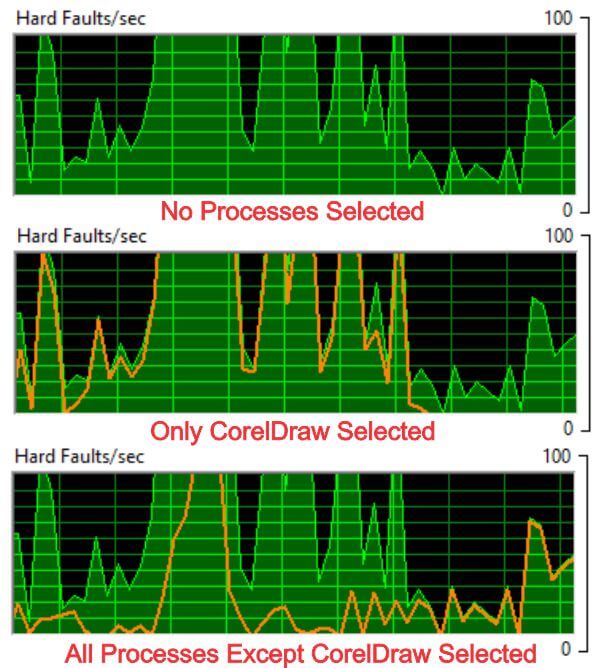
As you can see, using the information in the columns and isolating processes to view in the graph can give you valuable information in determining what processes are hogging your memory.
The final part of the Memory section is the Physical Memory chart. This chart give you a large picture of the memory on your computer and how it is allocated. It shows you in a glance the Available memory on the computer. If you were to add each of the memory segments, Hardware Reserved, In Use, Modified, Standby and Free, it must equal the Total shown in the list.
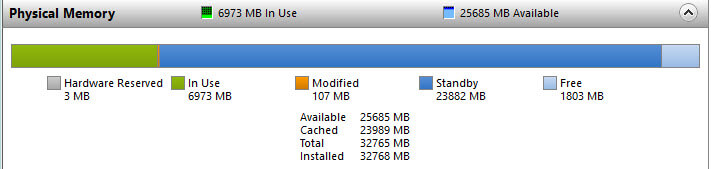
Hardware Reserved: In the graph above, the first item is the Hardware Reserved. In the case of this computer, only 3MB is reserved and because I am running 32,000mb, it is too small to show up on the bar. The hardware reserved shows the memory that the devices have reserved so they can communicate with the OS. These devices include the BIOS, any of the Motherboard components, some video and sound cards. If the amount on your computer is larger, that is not a problem but if it gets excessive, for example larger than 50mb, it might indicate that one of the devices on your computer needs to have the driver updated. I personally have never seen it over 50mb on any computer. This memory cannot be used for any other processes.
In Use: Exactly as the title explains, this is the memory allocated (being used) by the processes and drivers on your computer.
Modified: Modified memory is memory that contains data and was in use by the operating system and might be needed again. However the operating system will monitor this memory and move it to standby if it is not used. It will assume it is not needed and write the data to disk.
Standby: This shows memory that has been removed from working sets, see definition at the start of this section, but still linked to that working set. The OS organizes the memory in prioritized order. The shareable portion of the working set receives the highest priority. If one of these processes needs more memory it will retrieve it from standby, by taking it from the lower priority memory.
Free: The first thing to remember about free memory, is that your operating system is managing all your memory and the more free memory you have the less efficient it is. This is memory that is not in use by any process or driver. So do not be alarmed if this number is low. It just means that the OS is using it. Memory that is free is of no real use to the computer so it is better to use it.
Disk
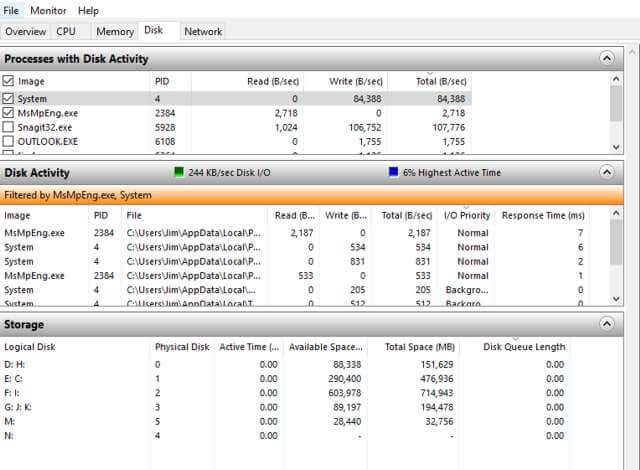
 The view on the left is a screen shot of the entire Disk tab. A lot of the processes in the previous two tabs also appear in the Disk tab but processes don’t always need to either read or write so you will have fewer processes displayed in the “Processes with Disk Activity” screen.
Use the image below to view the individual sections for this part of the post.
Processes With Disk Activity
The columns in the ‘Processes With Disk Activity” section start out with the, by now familiar PID. But now there are three new columns Read, Write and Total. All are show in average bytes per second within a 60 second time frame. Reviewing this information will give you a quick guide on which processes are reading and writing to the disk, it does not offer much more info than that.
Disk Activity
This section contains three additional columns: (Note; the items shown in the Disk Activity section may be filterd by selecting the Processes in the first section.)
File: The name of the file, including the full path, (you will have to increase the width of that column to see it all),
I/O Priority: The priority of the I/O transfers
Response Time (MS): This shows the disk response time in milliseconds. Instead of using the bytes per second shown in the other columns, the milliseconds view helps to better understand the efficiency of you disks. You will notice that the response time on my processes run from 7 to 0 ms. This is a decent response time. Anything “consistently” over 10ms indicates a slow response time. Most third party monitors consider anything over 15ms a problem and over 25ms critical. If your average I/O size is 2mb per second or larger, that could be the problem. If not, I would check the amount of disk fragmentation, if it is at a high percentage, that could be the culprit. Not having enough free disk space could also cause the problem. Try deleting all but essential programs and files. If you are loaded with audio, video or photo media, I would consider moving them to a DVD or other drive. Other than the two items mentioned, the next probable culprits are usually not good. Virus infection, hardware problem or a misaligned disk partition can cause disk I/O to be excessive.
Storage
The storage tabs shows the capacity and use of all storage devices.
Logical Disk: The drive letter associated with a disk.
Physical Disk: shows the physical disk associated with the logical disks being used. If you notice in the image below, my logical disks D: and H: are both part of my number 0 Physical disk.
Active Time in Percentage: The percentage of time the disk is actively servicing R/W requests. During the screen shot I just happen not to have any Active time so they are at zero percent. However, if your active time runs high, over 75% you might you may have an insufficient number of disks or disk space or the drive is too slow.
Available Space (MB): simply the amount of space not in use on the disk.
Total Space (MB): The amount of total space on the disk
Disk Queue Length: Queue Length should only be a problem if you have a limited number of disks. The operating system looks at all disk space on all drives so a high number may be normal. If you are running on one disk and the queue length is consistently over 3 and as high as 6 you may need to add a drive.
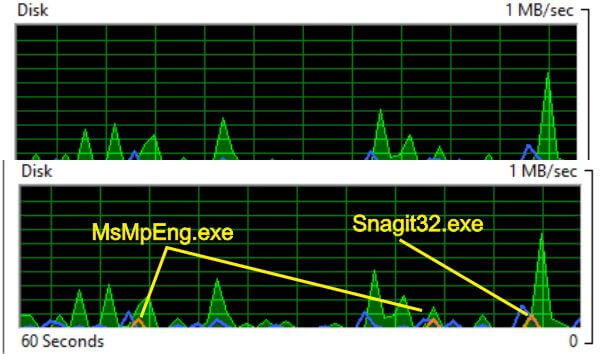
Graphs
The graphs can provide useful information as well. In the graphs below, the top one shows the disk action in green, blue shows the disk active time. Also, just like the CPU, you may select any process in the top section and see the result on the graphs. In the second graph I have selected two processes. The first is MsMpEng which is Windows Defender, and the second is a SnagIt a graphic program. You can see that their impact is minor, which is good. Processes that require high queue lengths could indicate an issue.
Network
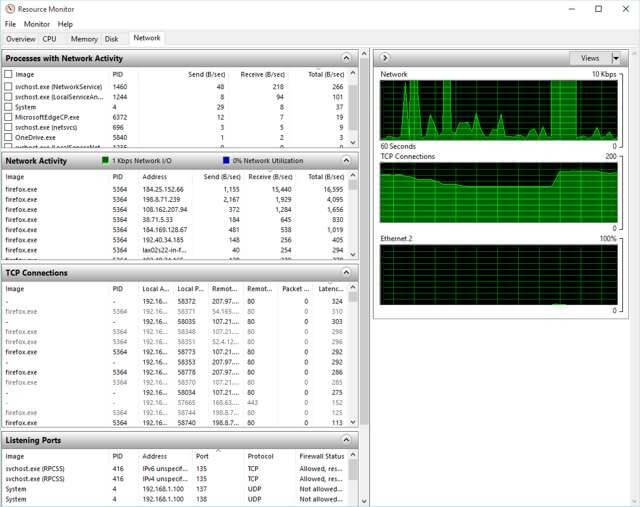
The final tab shows everything about your network activity. It displays the transfer rate for data sent and received in bytes per second. Besides the Processes common to all tabs, it has three additional sections.
Network Activity
This section contains a lot of useful information when troubleshooting the efficiency of you network. The section contains two boxes before we get to the headers within the sections.
![]()
Network I/O: The shows the total network use in Mbps.
Network Utilization: This shows the total use of your network. The lower the number the better. During network traffic, if this number approaches 100% or stays high for a long period of time it indicates that you do not have enough network capacity for your network activity.
TCP Connections
TCP stands for Transmission Control Protocol and it is the most common protocol on the Internet. The flow control on TCP determines when data needs to be re-sent if a mistake is made. The information columns withing this section include:
Local Address: Each network adapter may have multiple IP address assigned to it. The information in this section will tell you if one IP address might be slowing down the throughput.
Local Port: Printers and other devise may use the local ports on the network adapter.
Remote Address: This is the address that others see when you connect to them. Every computer has a unique IP address.
Remote Port: The remote port of the connection. Usually a port like 443, 80 or 21.
Packet Loss (%): Information is sent in packets, the more packets lost the worse the quality of the connection. Large number of packet losses might require a retransmission of a download or prevent it altogether.
Latency(ms) This is the time it takes for data to go from one point to another. If this number is high it would be unlikely that you would be able to stream video. When data is sent there is a delay experienced. Any number below 100 would be good and fast internet connections might get it down to 50. Once you exceed 300, it might be too slow for gaming or video. 250ms means that there is a quarter of a second of lag between you and the server. 50ms would mean the lag is only 1/120th of a second. Therefore the lower the better.
Listening Ports
Each program has a port associated with it.
Address: The port number helps the system know which applications should receive the data. Some processes are specifically tied to a specific local IP address for either IPv4 or IPv6. Seeing an address like IPv6 unspecified just means that the binary bits are set to “0”
Protocol. This will either be TCP as explained above or UDP (User Datagram Protocol) this protocol is used when downloading things like video because unlike TCP there is no packet verification of delivery and therefore much faster.
Firewall Status. If the firewall is blocking traffic, you will see it by checking this column.
Graphs
The graphs in this section have three graphs because I have a second Ethernet adapter, However, most will only have the first and second graphs. Like all previous sections, selecting a process will give an orange indicator within the green graph.
Note: Checking the services using the ports on your computer through resource monitor was an excellent way to determine if malware was using a port or transmitting information on your network. However, some of the smarter virus and malware can bypass resource monitor. To effectively determine what is using your network, I recommend using the command netstat in DOS. This will display the protocol statistics and current TCP/IP network connections on your entire system. To use netstat, open CMD as an administrator and type netstat help. This will bring up the possible syntax combinations for using this command. For example -a displays all connections and listening ports, -0 displays the owning process as a PID. There are 14 different operands that you may use with the netstat command.
The following graphic shows my TCP/IP after the following command c:\netstat -a -o -f

Summary, Resource Monitor is a very helpful tool in troubleshooting your computer. Understanding every aspect of the program can take time but several of the sections can give you a heads up just by glancing at the data. It is just one tool in the Administrative Tool Suite already on your computer. Don’t be afraid to open and view the information, it is there to help. Just don’t start killing a lot of processes without knowing the end result. I think if you click on any of the processes in any tab you will see exactly what that process does to your system and how it impacts your performance.
This is the first part of this series. The next post will be discussing one or more of the Administrative Tools.
Jim
Excellent article. A very good description of what is usually a hard-to-understand topic for beginners. I hope the continuing articles on the other Admin Tools are as well done. These will make an excellent set of bookmarks for future reference. Thanks Jim!
Thank you for your comments Bob, I hope to do even better on the following articles. See my comment to Sheri below.
Jim
I consider myself to be a bit above an ‘average user’ – when I compared my PC knowledge to everyone I know, at least! And I know of the existence of Resource Monitor and a lot of other tools in the Administrative tools. I also know that you can click on each resource to get a fuller picture. But seeing the information and using it to help resolve an issue are two quite different things and try as I may, I have never been able to USE any of the information I have found to resolve an issue. And I’m afraid that your article has failed to help me understand how to use Resmon 🙁
Sheri, I already know you are an above average user if you are on DCT. I am sorry that I did not convey a better understanding of the tool. I hesitated writing about it because it can be daunting but thought a basic understanding might help new users try the tool. I understand your comment though, Resource Monitor and Process Monitor are certainly helpful tools but understanding a specific practical use without a current problem is difficult to grasp. For example, if you open “resmon” and you do not have an actual problem to analyze, the tool does not really reveal much. However, if you have a program that is hanging or if your network appears to be bogged down it can be a powerful resource to troubleshoot that problem. In my next post, (in part because of your helpful comment) I will attempt to address one or more practical uses. I can’t promise that they will instantly make a user understand how to apply it, but that will be my goal.
Jim