I’ve always been fascinated by various Forces of Nature. From Hurricanes and Tornados, to Earthquakes and Volcanos, Nature has many options at its disposal to unleash on the planet in always impressive, and usually destructive ways. As a Tech, it was natural for me to combine my fascination of these Forces of Nature with the Inter-webs. The result: I’ve been internet tracking Hurricanes now for about 15 years, and this week was no exception. What started as curiosity has developed into a familiarity with the tools meteorologists use to provide viewers with up to the minute information, and a healthy respect for these amazing Forces of Nature.
Anyone with an interest and access to the inter-webs can take part, meteorology degree not required. (But if you are pursuing such a degree, there are a wealth of tools for you, too.) If you are in the path of one of these storms, I urge you to follow the directions of your favorite weather-persons, as well as your local officials. Be safe out there.
In the meantime, it doesn’t hurt to put together a bag of tools to better understand these forces.
The Tools:
The National Weather Service’s National Hurricane Center website: http://www.nhc.noaa.gov

The first tool in your bag, and really the best tool. No other source provides access to so much information.
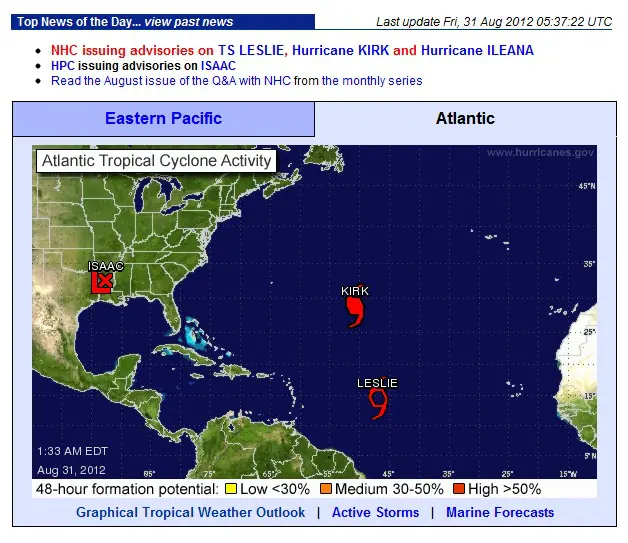
When you first visit the page, the first thing you’ll notice is the Atlantic Tropical Cyclone Activity Map, which is interactive on their page. Just hover over, and then click on a storm for your first taste. It takes you to a named storm page.
This gives you access to specific storm information and graphics, the same ones you see on your favorite news program. I recommend clicking on Archive, and then Graphics Archive, and trying out the links you find there. Basically, they’ve stacked the graphics into an animated GIF, providing you with the 3 and 5 day cones which are the predictions of the weather models. The 3 day cones are generally very accurate, while the 5 day cones are less so, though certainly much more accurate than they were 15 years ago.
Back on the named storm page, the links at the top give you access to the official Public Advisories, which is deliberately formatted, allowing the data to be scraped by many other weather tools, including some tools we’ll discuss later. Updates occur generally once or twice a day, but increase to every few hours as a storm is approaching land. For me, the “DISCUSSION AND 48-HOUR OUTLOOK” all the information I need. It gives you the wind speed, the category, the size and location, and in my opinion the most crucial piece, the minimum central pressure.
Between the Public Advisories and the Graphics, you might overlook the ever-present menu on the left sidebar. But this sidebar provides links to tons of information about storms in general, including a large section on Outreach & Education, which breaks down the Saffir-Simpson Wind Scale, provides information on how to Prepare for a coming storm, explains Storm Surge, Cyclone Names and much more. But by far one of my favorite links in the menu bar is under Tools & Data: the Satellite page. This page contains an enormous amount of links to satellite images and movies, both storm specific via the GOES Floater Imagery, or broken into sectors both in the Atlantic and Pacific. Below that, you’ll find links to the filtered images used to glean the most information from the satellite data.
I recommend trying out the Visible and IR Flash links of your choice from the GOES Floater Imagery, and then scroll to the bottom and check out the POES Composite (Daily Sea Surface Temperatures) Java. (Yes, Java, taking into account Jim’s caution).
What’s that? Still not impressed? Go back to Tools & Data and click on Aircraft Recon. This page give you the Aircraft Reconnaissance schedule, and provides links to the pages of the Hurricane Hunters, themselves: The 53rd Weather Reconnaissance Squadron, 403rd Wing, Air Force Reserve Command, Keesler Air Force Base in Biloxi, Mississippi, and the NOAA Aircraft Operations Center, MacDill Air Force Base in Tampa, Florida. From these pages you find links to photos. Photos of the planes. Photos from the crew. Photos out of the plane as they look out from within the eye, as they did here in these shots of Hurricane Katrina.
It is easy to get lost exploring all the information the NOAA site provides, but the reader can take in as little or as much as you like. I’ve wasted hours on their Historical Hurricane Tracks tool alone.
The Hunt: Streaming Media and local CAMs
About 15 years ago, when broadband was first taking hold, many TV stations were not broadcasting on the internet, and the only source of local video on the internet was Live Local CAMs. These consisted of Traffic CAMs designed to provide local commuters an idea of what traffic was like on their daily commute, weather cams put up by local news stations, and other CAMs some cities would put up of various places around town. Based on the information from the NOAA National Hurricane Center, and just prior to landfall, I would Google Live CAM with a city name near where the storm was expected to make landfall. Sometimes I would have up 4 or even 6 CAMs at a time, while continuing to explore the NOAA data and the new feeds. And these provided a visual record of the passing of the storm, though some would refresh with far less frequency than I would have liked.
But times have changed, and now local channels will stream a news broadcast for the entire duration of the storm, 24 hours a day, and have reporters putting themselves in harms way, such as Jim Cantor during Hurricane Isaac: [youtube]http://youtu.be/y6LtYejsnp4[/youtube]
Even the big name reporters get in on the action, including Anderson Cooper from CNN and Al Roker from NBC, But the national news sites will often stream to you only if you are Cable TV or Satellite TV subscriber, and the information for non-subscribers is sparse. The local affiliates of the prime stations do the real work. And it is as easy as doing a search for your favorite brand.
For example, this past week, I Googled New Orleans NBC and New Orleans FOX, and both news stations provided 24 hour live streams, with re-broadcast from stations in Shreveport. They do all the work for you. No need anymore to keep up individual webcam sites, unless you really want to do so.
Other Resources
- NASA maintains a webpage featuring stunning images and movies from the GOES Satellites. These much more polished that the raw views they make available to NOAA, [youtube]http://youtu.be/0U9vKASN3XA[/youtube]
There are many other website, some working in tandem with NOAA’s NHC, and most regurgitating information directly from NOAA. Some offer further analysis of the storms and computer model forecasting. Here are a few links, though many more are available.
- FEMA – More preparedness information, and how to get assistance afterwards.
- Hurricanescience.org – the math and science behind Hurricanes.
- HurricaneNow.com – commercial site which aggregates different sources during live events.
- HurricaneCity.com – commercial site aggregating information and providing forums.
There are also apps available for both iPhone and Android, free and premium:
Titles for iPhone include:
- Hurricane Express and Hurricane by Kitty Code.
- HurricaneTrack by HurricaneTrack.com
Titles for Android include:
- Hurricane Hound and Hurricane Hound Free by STKI Concepts
- Hurricane Software by HurricaneSoftware.com
I’ve been using Hurricane Hound Free, and it gives me all the good updates I need while away from my desktop.
What I’ve learned Q&A:
Why are there hurricanes? What purpose do they serve?
A hurricane is Nature’s way of cooling the oceans. Warm water is hurricane fuel. Now, the cyclone doesn’t directly suck up the heat and convert it to energy, but there are a number of processes which together have a dramatic cooling effect on sea surface temperatures along the path which can cool the waters by 4 degrees Celsius or more. This cooling has been found to help coral reefs recover more quickly from bleaching events. The warmer the waters, the bigger the storm.
Why is the minimum central pressure the most crucial piece of information?
The minimum pressure is a very accurate indicator of whether the storm is gaining strength, or losing it. NOAA provides this information in both millibars and inches.
A tropical cyclone forms around an area of low pressure. As they are forming, we’ll see pressures in that area around 1000 millibars. When the pressure has gotten down to around 975 millibars, we’re usually looking at a Category 1 or even 2 storm. If the pressure drops significantly, let’s say 950 millibars, now we’re looking at a major storm, Cat 3 and stronger. It is rare for storms to go below 925 millibars, and these low pressures always make for very intense storms. The record in the Atlantic basin is held by Hurricane Wilma, 2005, at 882 millibars. Coming in at number 6, Hurricane Katrina that same year managed to hit 902 millibars at its peak.
So, while the current sustained wind speed is important information, the pressure is telegraphing how that intensity will change. This is how your local weathermen are able to provide you with guidance.
Why do hurricanes behave the way they do? Why do they stall?
As devastating as a hurricane is on land, hurricanes are actually not the biggest hitter in terms of weather. Their path and their behavior is always dictated by many factors, including sea surface temperatures impacting intensity, and the Jet Streams providing major momentum allowing storms that formed off the coast of Africa (and referred to as a Cape Verde storm) to travel all the way across the Atlantic and threaten coastal cities. Also, other high and low pressure systems currently affecting the weather in a region usually has push/pull effects on hurricanes. Over them all, the Jet Streams of our planet drive even the largest weather systems.
A perfect example would be the “Perfect Storm” in 1991. Hurricane Grace, a Cat 2 storm, was absorbed by a larger system of low pressure, and became the Halloween Nor’easter of 1991. This shows that hurricanes are relative lightweights in the overall weather of a region.
This past Tuesday morning, weathermen were suggesting that a large area of high pressure was moving slowly east, and Isaac was bumping up against it, slowed and stalled.. And so Isaac sat there, just off the coast of Louisiana, in that warm water, the pressure dropped to 968 mb, the sustained winds increased to 80mph, and it proceeded to pound on Southeastern Louisiana in what proved to be sustained testing of the 15 billion dollar levee system. Other levees not included in the revamp were over-topped, flooding some sections near New Orleans.
So, knowing what all the other, larger weather systems in the region are doing, and especially what the Jet Streams are doing, gives us the hurricanes path, and the sea surface temperatures give us the intensity. Add in all the rest of the math, and we can predict a storms behavior with some degree of accuracy. And this information shows why hurricanes behave the way they.do.
The Red Cross has setup a Disaster Relief page.