Understanding Resource Monitor
The Resource Monitor Screen allows you to see exactly what is happening for each resource. It provides a similar but more detailed view than the Performance tab. The Menu has three options:
- File – Save Settings As: Saves the current configuration settings in XML format. It includes user resource monitoring selections:
- Processes: Choose which process(s) to monitor
- Charts and Tables: Configuration for displaying real-time data on CPU usage, memory, disk activity, and network traffic. The specific details will vary based on your preference and system configurations at the time it was saved.
- File- Load Settings: This will open a previously saved Settings file. This is useful when comparing live data against a known configuration or troubleshooting specific issues.
- File- Restore Default Settings: Revert to the default values.
- Monitor – Start Monitor: The graphs will start showing data.
- Monitor – Stop Monitoring: You may use this to freeze the data and examine specific graphs or details without scrolling out of view.
Tabs
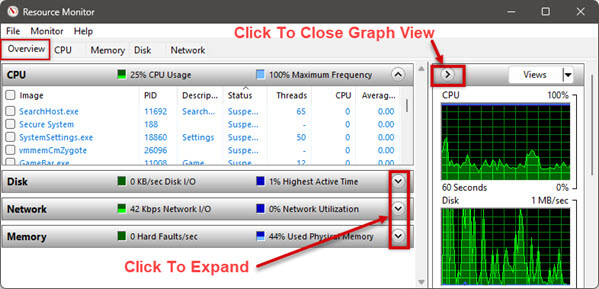
‘Overview’ is the first tab in Resource Monitor and displays just that, an overview of the CPU, Memory, Disk, and Network resources simultaneously in expandable sections. Clicking on any other tab displays different expandable sections that are relevant to that resource. You may collapse or expand any section. Each tab has its own set of column headers.
The graphs in the right panel illustrate resource usage over a 60-second interval.
The first expandable section for any tab provides a set of checkable boxes you can use to isolate a single process. Checking the box(s) in the Overview tab will create a filter that will be used for the rest of the expandable sections. Isolating a single process can help understand its impact on a resource. In other words, if Winword.exe is running and you place a checkmark in the first section, each subsequent section will be filtered by WinWord.EXE.
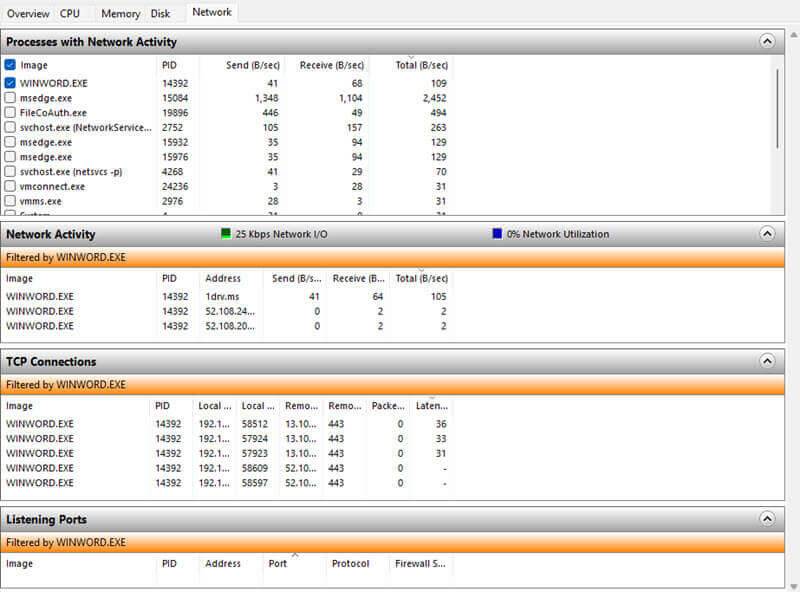
The same thing can be accomplished for each tab. Suppose you select the Network tab and click on a checkbox in the first section, “Processes with Network Activity”. In that case, it will display the Network Activity, TCP Connections, and Listening Ports in the subsequent sections. Any box checked will show as checked in all tabs.
Graph Views
The right pane displays a real-time graph for each resource. The default view is green. If you check a box in the left pane, the data will be displayed as an orange line in the graph.
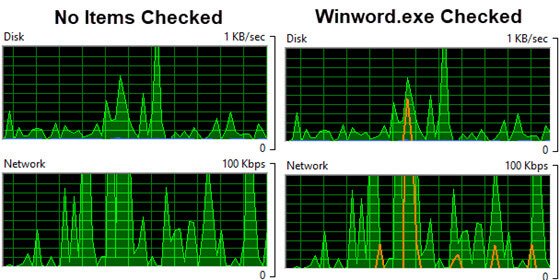
The graphs can display any of three colored lines: green, blue, and orange.
- Blue: Represents the maximum utilization percentage. This line corresponds to the percentage of Highest Active Time for a specific resource. It shows the maximum utilization percentage of that resource during the monitoring period. In the disk graph, the blue line indicates the highest disk activity percentage observed during the monitoring interval
- Green: Default color, Displays the current I/O rate for the resource. Green shows the (combined read and write data) for disks, It shows the total I/O rate in kilobytes per second (KB/sec) or overall data flow for that resource
- Orange: The orange line is specific to a highlighted task or process. If you place a check in the box to the left of Winword.exe, the corresponding activity is highlighted in orange on the graph and is specific to that app. This gives you a focused view of the impact of those tasks on system resources. If you notice a high usage of your disks, you can checkmark a process and see that process’s impact on the I/O activity by viewing the orange line
Summary
Each Resource has its own selection of column headers and expandable sections. Trying to explain the function of each column header and the data displayed in each section is beyond the scope of this article. Additional Indepth can be viewed at the OpenText Documentation Portal. My goal is to get users tinkering with the Resource Monitor so they can gain insight into their systems. I have been using it for years to help my clients’ computers run faster. Task Manager has several more options covered in the next articles.
—
So, where is the Resource Monitor??
Darwin, the Resource Monitor is visible after clicking on the Performance Tab. it is at the bottom of the window in Windows 10. However, in Windows 11 it requires an additional step.. While in the Performance tab. click on the ‘…’ (ellipsis) at the top right of the window and on the drop-down menu, click on Resource Monitor.
Jim