App History and Startup Apps
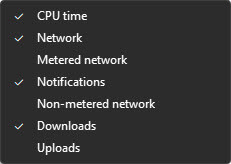
App History, the third tab in Task Manager uses the same column format to organize data. A brief description of the column titles is below:
- Name: The application or process’s name
- CPU Time: Indicates the total CPU time consumed by any specific app
- Network: Displays the app’s total network usage in megabytes
- Metered Network: Shows metered network usage
- Tile updates: (Windows 10 only) Live Tiles like news or weather widgets perform in live updates. This column will display the resources used when a tile is updated. Some update frequently like the news widget and if you are on a metered network you might want to optimize battery life by restricting this app from running
- Non-Metered Network: Shows network usage on networks that are not marked as metered
- Downloads: Shows the amount of data downloaded by any app in MB
- Uploads: Shows the amount of data uploaded by any app in MB
How To Use App History
The process and Performance screens show real-time data, any process might spike and rest back at zero. App History collects and reports resource usage statistics for apps and processes run on your computer over the last month.
The data views are the same as those on the process screen, but it provides you with a historical view of resources over time. This is very useful for laptops, tablets, and devices with limited resources. This deeper understanding of processes over time gives you the real picture of process usage and their impact on system performance. After making any changes you can Clear usage history and History App will start scanning for another 30 days.
Startup Apps Tab
The fourth tab in Task Manager is The Startup screen. It is the fastest way to add or remove applications from auto-starting at bootup. Some apps can create their own startup without your knowledge. To me, there is no reason to auto-start an app that I can start later at any time. Particularly if it extends my boot time.
Column Headers
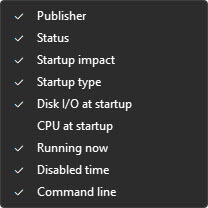
The overall functions are like previous screens. You may move columns left or right, delete/add columns for a better understanding of each app:
 Name: The name of the app or process
- Publisher: Company that provided software
- Status: Shows If the app is enabled or disabled for startup
- Startup impact: How the impact at startup High, Medium, or Low
- Startup type: Displays the method used to start the app. Registry, Folder, etc
- Disk I/O at startup: This refers to the input and output operations on a disk drive(s)
- The important thing on analog drives is access time which includes the time required for the disk to rotate to the required sector
- Disk latency (Average access time) should be around 13 milliseconds compared to RAM latency which should be around 83 nanoseconds
- Caching data in memory is crucial for performance because the difference between RAM and hard drive latency is so big
- CPU at startup: Reflects the CPU usage caused by the app during startup
- Running now: Displays if the app is currently running
- Disabled time: Shows the time the app was disabled
- Command line: Displays the command line expression that started the application
Summary
App History provides historical data for the last month. Excessive resource usage can be easier to spot over time. This gives you the opportunity to stop the process in Windows 10 or apply the Efficiency mode in Windows 11 to a specific process.
Startup provides an easy way to enable or disable an application from auto-start and it lets you delete it and does not contain all the processes or apps that actually AutoStart. Microsoft Sysinternals “Autoruns” allows you to delete an app from the list. Download the file from Sysinternals and use it as directed in this article. Once deleted in Autoruns, it will disappear in Startup.
—

