How cool is my PC?
I confess to being a sucker for desktop monitoring utilities probably because, like the proverbial Magpie, I love to see gauges, LEDs, tuning knobs and dials. Maybe it was all those home brew electronic sets I had as a kid or that crystal radio I managed to clamp to the bedroom radiator and pick up the BBC World Service on, who knows? If it’s got flashing lights, winking diodes and it’s shiny, I want it.
Why monitor your PC? If you’re driving your car around every day you’ll be wanting to know how much fuel you’ve got and whether the engine is about to go pop and leave you stranded, plucking the banjo whilst squealing like a pig Deliverance style. You wouldn’t want that would you?
Which hardware monitor should I choose?
A PC is built with several core components and until the day arrives when it’s powered by a single blob of ice cool Kryptonite, we’re stuck with silicon chips that get hot and need to be kept cool by all means necessary.
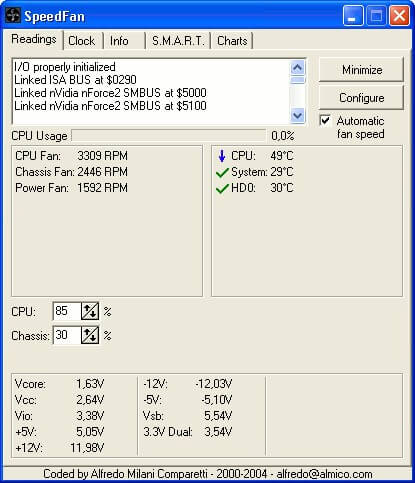
There are now hundreds of monitoring utilities available, many of which are provided by your motherboard, CPU or GPU manufacturer and many others by independent programmers and large corporations alike. In the early days only a few were available such as SpeedFan and Everest, which were both Windows 98 friendly and gave you real-time monitoring in an easy to use but albeit, rather dull interface.
The beauty of almost all hardware monitoring programs is that most of them are totally FREE OF CHARGE, so don’t for a minute consider paying for one when you simply don’t need to. Most monitor software will tell you much more than just your temperatures and fans speeds, with detailed information on CPU, motherboard, GPU etc and can be really useful for reminding you of your motherboard model and BIOS details.
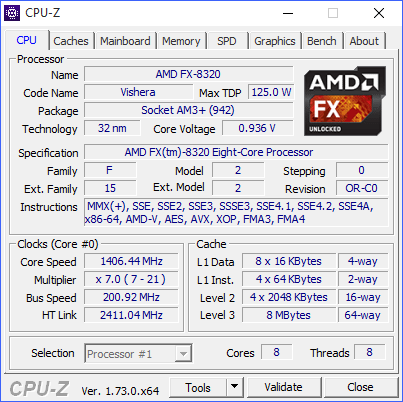
On a basic level, one of the most popular little programs to start off with is CPU-Z which gives you a handy summary of your motherboard, memory and GPU.
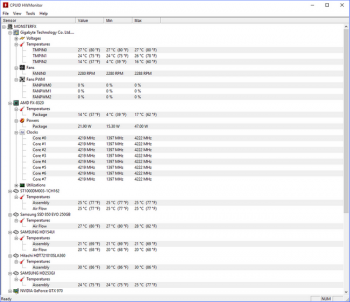
From the same people who produce CPU-Z is HWMonitor which has become pretty much the default choice for many due to its simplicity and tiny footprint. There’s a mass of information at hand and at a glance one can immediately see the current state of the PC. The pro version allows temps to be shown in the taskbar among other extras.
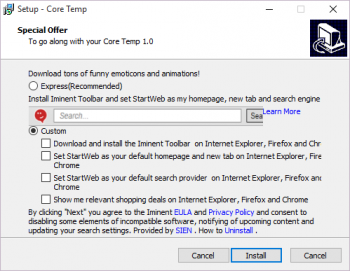
For a slightly more visual effect, you could try Core Temp which also gives you a desktop gadget to play with. However, it’s worth mentioning that Google has flagged Core Temp’s homepage as dangerous and they’re right. Chrome won’t even let you download the program, so I used Internet Explorer 11, opened the file and this is what I got:
In spite of deselecting the malware options, they still installed themselves and I ended up with a pile of steaming crap on my PC, so I warn you NOT to approach Core Temp under any circumstances.
PC monitoring for gamers
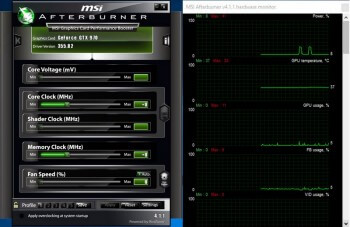
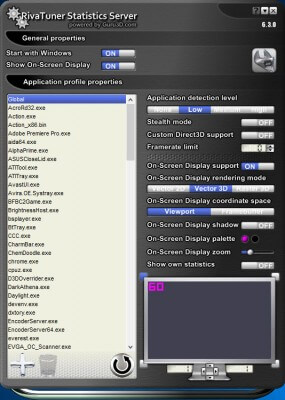
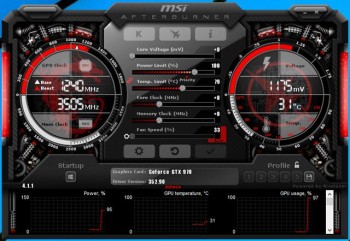
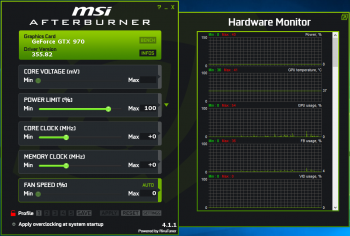
Moving on, if you’re a gamer, monitoring your system temperatures is even more important, particularly if you overclock your CPU. I have my AMD FX 8320 overclocked from the stock 3.5 Ghz to 4.2 Ghz, which isn’t a huge leap of course, but monitoring the temps when under load can be very handy. Possibly the most dynamic and comprehensive monitoring tool for gamers is MSI Afterburner, which when paired with Riva Tuner, gives you a powerful and highly flexible (tweakable) little program in a tiny package, which works with both AMD and Nvidia GPUs and Intel or AMD CPUs.
Actually, when you download and install Afterburner, Riva Tuner comes with it and forms the integral link for the all important OSD (on screen display). This package is pretty much indispensable for GPU overclocking and monitoring and changing the skin really personalises the program just how you like it.
Now, is that not sexy or what?
All the information you need at your fingertips in a customised skin that really stands out. Of course, you can minimise the program to the taskbar and simply have a discreet couple of indicators that you can keep an eye on without having to clutter up the entire screen; the choice is yours.
The tiny image above gives you an instant snapshot in-game at a glance which can also be achieved with HWInfo, which from my point of view is the most comprehensive of the lot. Take a look at this shot and tell me you’re not impressed. The highlighted areas are separate information modules and can be minimised to the taskbar.
I use HWinfo and have it load at Windows start up, minimised to the taskbar, so at a quick glance I can see the temps of both GPU and CPU; very handy.![]()
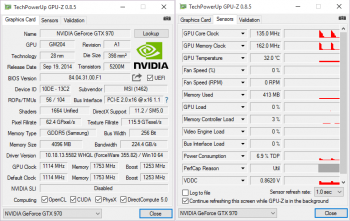
From TechPowerUp you can also grab GPU-Z which not only gives you a mind boggling summary of of your GPU, but it also shows you sensors, fan speeds and other useful read outs.
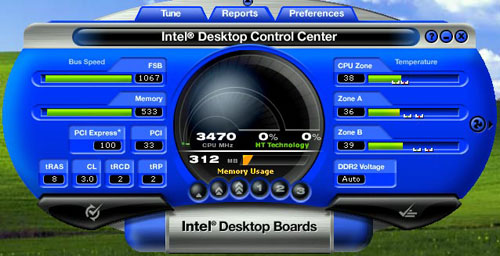
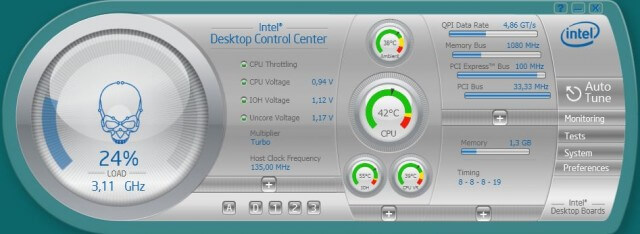
Many utilities are hardware specific for a particular brand, for example Sapphire Trixx will only detect AMD graphic cards and Intel’s Desktop Control Center will only function on an Intel mainboard.
Conclusion
I’ve tried to include as many monitoring programs here as possible and naturally it’s up to you which you choose. There appears to be a myth swirling around the net that running more than one of these types of programs will cripple your PC. All I can say is that I’ve run five or six simultaneously just for testing purposes ( I may have forgotten to shut one or two down) and came across zero problems, but would normally only run one or two at a time maximum.
It’s also worth pointing out again that all the programs mentioned here are free and require no registration or fees. If you come across monitor programs that insist on registration, products keys or say it’s a free trial and try to dump crapware on you, steer clear. It’s a shame about Core Temp, because when I originally downloaded the program, it was totally malware free.
- More reading on basic monitoring here: Peeking Under the Hood: System Information & Monitoring Tools
Happy monitoring!


Sorry, accidentally hit the Enter key and posted that spam above, please delete.
What I wanted to post was about the warning about the Core Temp installer, it seems to have a wrapper for the malware installation and if so, there’s a way to get around that easily.
Use 7-zip to extract the Core Temp installer by itself and leave the crapware behind, I do this for any installer that bundles crapware with the original program installer.
I will run a test of this in a sandbox and post back if this method works here as well, I’m pretty sure it will as this seems to be a standard installer wrapper.
Dave
Hi
I think the crapware installer wrapper was added by the site you downloaded it from, I got it from the Core Temp site here – http://www.alcpu.com/CoreTemp/ – and there was no added software whatsoever in the installer, Chrome had no issues with the site and didn’t balk at the download. I ran a a system monitor during the d’load and nothing was installed surreptitiously.
So the question is, where did you d’load your evaluation copy? As you probably know, most mirror sites add wrappers to the software installer because they make $$$ from it, the actual developer rarely does this if they also offer a download on their site.
Well that’s odd Dave C.
I just went to their homepage again and as you say, there’s no problem with their download and no bundled crapware.
In fact, the program installed just fine, whereas the week when I wrote the article it was a very different picture as I highlighted.
Thanks for the tip either way.
I use two that seem to do it all… Process explorer, and WiseCare. The latter is awesome and one of the few that actually does as promised. Both free. Shows cpu and temp in a tiny window on desktop that you can put where you want.
mike