How cool would it be if you could have an animated pie chart in your annual meeting PowerPoint presentation? I think it would be very cool and would really look like an employee who goes the extra mile and knows their way around the software the company uses. It always amazes me that most companies do not invest in software training for their employees.
We all know that charts are very handy when showing a visualization of your data. But, adding animation is taking it a step further, allowing you to show one area of your pie chart at a time, stopping for analysis of each one.
Follow the steps below to learn how:
- Launch PowerPoint.
- Locate and open your PowerPoint presentation.
- Navigate to the slide where you would like your animated pie chart added.
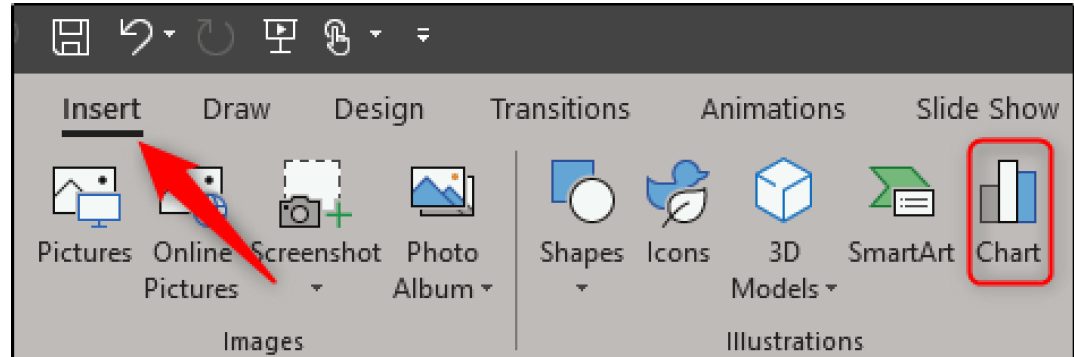
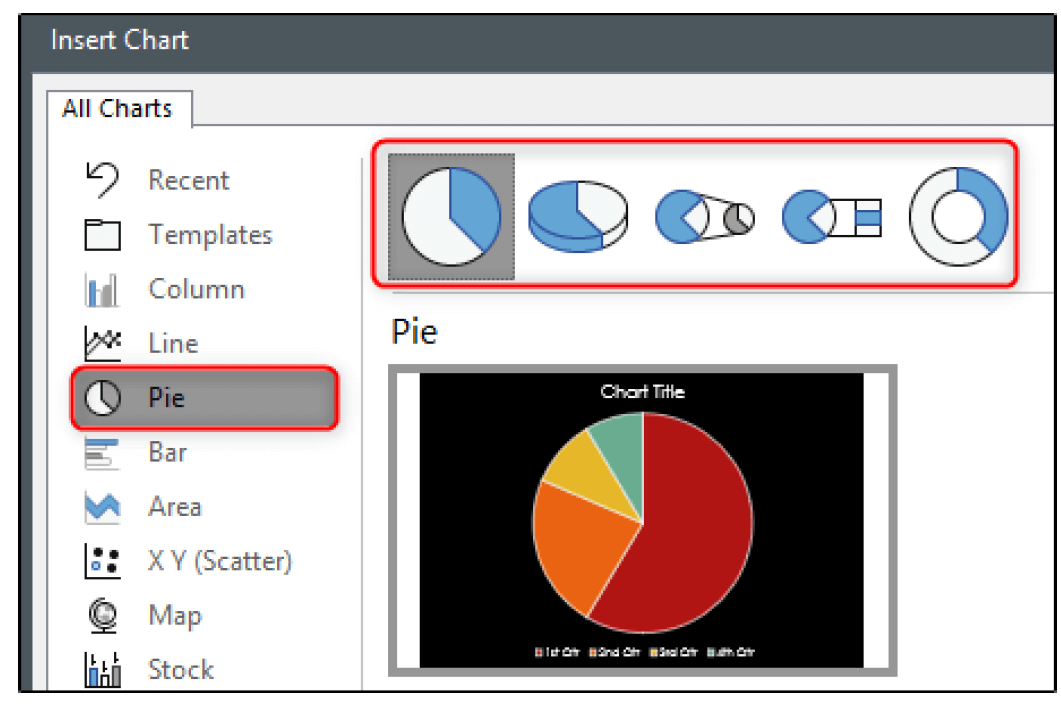
- In the Insert Chart window that opens, on the left, choose Pie. On the right, choose the pie chart style that you would like to use. There are five different options to choose from. Once you have made your choice, at the bottom right side of the window, click OK.
- You will see that the pie chart has appeared on your slide and with it, an Excel chart.
- Change the labels of your pie chart by editing the text in column A and key in the respective data in column B.
- Once you have done this, close your worksheet.
- Now, select your pie chart and click the Animations tab. Once it opens, select the animation you would like to use from the options that appear.

- Click the Animation Pane to open it.
- The Animation pane will appear to the right of your slide. Now, double-click the animation you previously added to your pie chart or click the arrow next to it.
- Select Effect Options.

- A window will open showing the following options: effect, timing, and chart.
- Now go to the Chart Animation tab and you will then be able to select how your chart animation will behave– either As One Object or by Category. Selecting As One Object will make the whole chart appear at once. Selecting By Category will make your chart appear on a slide at a time, so select that.
- This is so versatile that you can even decide whether you want the animation to begin by drawing the chart background.

Once you click OK, your pie chart will look the same when using editing view but if you press Shift + 5 to play your slide, then you can left-click your mouse to watch your new animated pie chart.
How cool is this???
—