Very often graphics are used in worksheets. Sometimes the graphics are used to demonstrate what resides in the cells and that is fine. Usually graphics sort with cells well. However, when you apply filters to those cells the graphics sometimes bunch up at the top of the visible cells. Wouldn’t it be lovely if we could hide those graphics when filtering our data within cells?
Well, it can be done, but it is dependent upon how you have the properties for your graphics set up. You will need to be certain that the graphics are set to resize when the row height changes.
Follow the steps below to learn how:
- Select the graphic(s) whose properties you would like to modify.
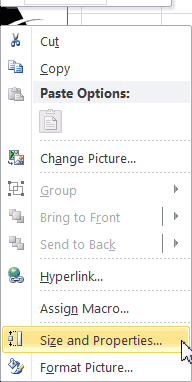
- Right-click the graphic(s) to open a Context menu.
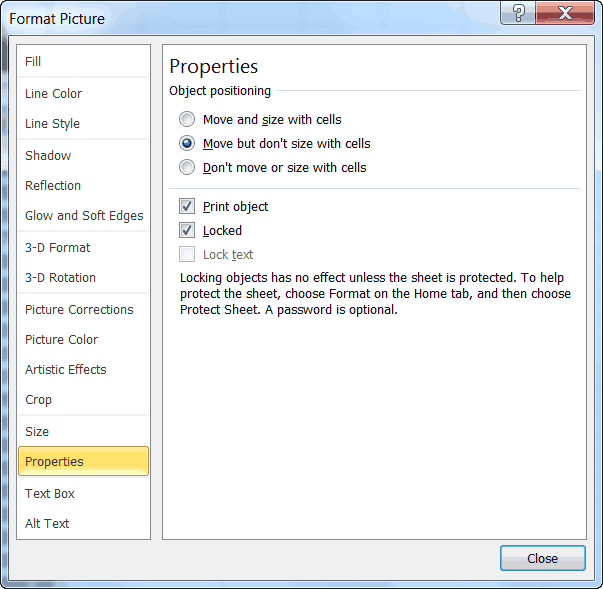
- Select Size and Properties from the Context menu to open the Format Picture dialog box, which should have Size selected on the left-hand side of the dialog box.
- Click Properties on the left side.
- Be certain the Move and Size with Cells button is selected.
- Click OK.
Step number five is the hero here. Because your graphics are sorting properly when you sort your worksheet, usually it is because you had the Move but Don’t Size with Cells selected. This is what causes your graphics to bunch up because they could not resize when filtering hid the rows they were associated with.
—


