Some folks think you need another program entirely, such as Visio, to create an organization chart. Not so! There is a much easier way to create an organization chart and you can do it right within Word! It was not always as easy a task in earlier versions but Word 2010 makes it quite easy, using SmartArt, which is a great feature!
So, let’s get started! Follow along with the steps below and create your Organization chart in Word 2010!
- Launch Word 2010 if it is not already open.
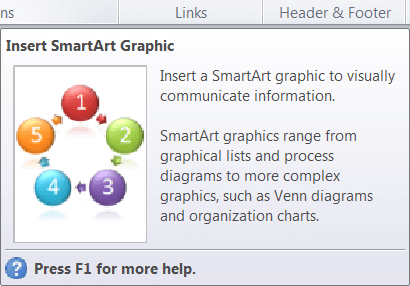
- Hover your cursor over the SmartArt icon and you will see this:
- On the Insert tab of your Ribbon, click on SmartArt.
- Once you have clicked it you will see many options, as well as many categories contained in SmartArt. For our purposes, click Hierarchy.
- Next, click on Picture Organization Chart.
This type of chart can be very helpful in a large organization because you can place a face to the name of the person.
- Once you have selected the Picture Organization chart, click OK.
You should now see something like this:
When you insert your chart, notice that you get several options. At the top of your screen, you will see the SmartArt Tools Contextual toolbar with two tabs, Design and Format.
In the body of your document, you will see a small chart that is ready to be filled in by you. To the left of your chart, you will see a window where you can key in the text you would like in each block of your chart. When you begin to key in information, note that the font will become smaller to fit in the block.
There is also a small picture icon located to the left of the name block. If you click that icon, a dialog box will appear where you can insert a photo of that person.
There are many options to change the appearance of your organization chart. If you would like to add additional subordinates under a person, simply right-click their name on your chart, then find the Add Shape option from the resulting menu and click where you want the new block to be positioned.
The default color of the chart is blue, but there are lots of color selections. If you look at the Contextual toolbar at the top of your screen, that I mentioned above, you will see that you can change both the layout and the color of your chart.
You have many options available to you on the Contextual toolbar, such as changing the shape of your blocks. If you hover your cursor over an option, your chart will change to show you how it will look with that particular option applied.
You will now look like the Office Pro when you distribute your Organization Chart!

Word is a great option for organization charts, but you should also check out Lucidchart. They have some great Org Chart Software. http://support.lucidchart.com/entries/21691755-Create-an-Org-Chart
Thanks Marcy! I will definitely check it out.